Automatically enclose points in a polygon
geom_encircle(mapping = NULL, data = NULL, stat = "identity",
  position = "identity", na.rm = FALSE, show.legend = NA,
  inherit.aes = TRUE, ...)
Arguments
| mapping | mapping |
|---|---|
| data | data |
| stat | stat |
| position | position |
| na.rm | na.rm |
| show.legend | show.legend |
| inherit.aes | inherit.aes |
| ... | dots |
Value
adds a circle around the specified points
Details
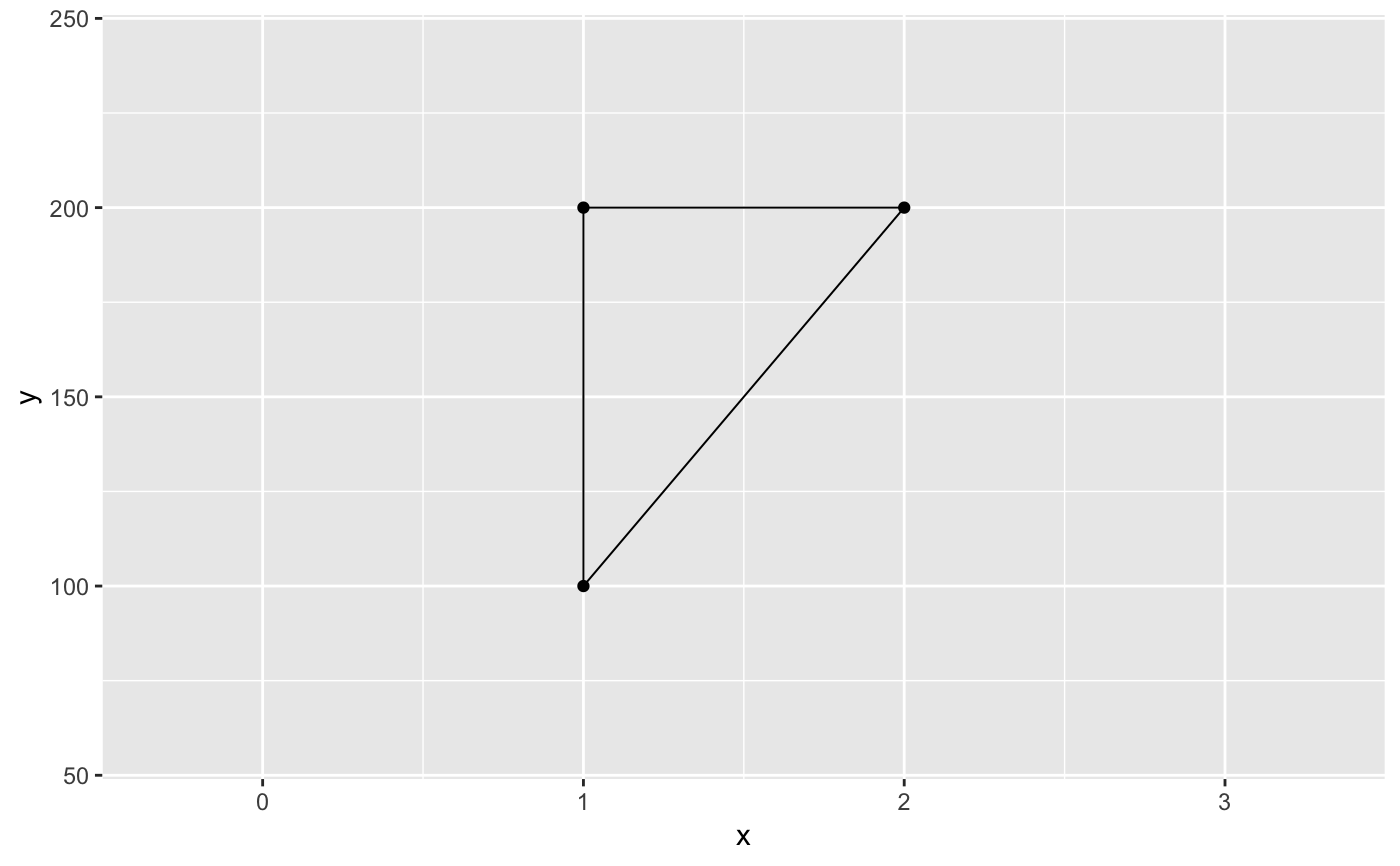
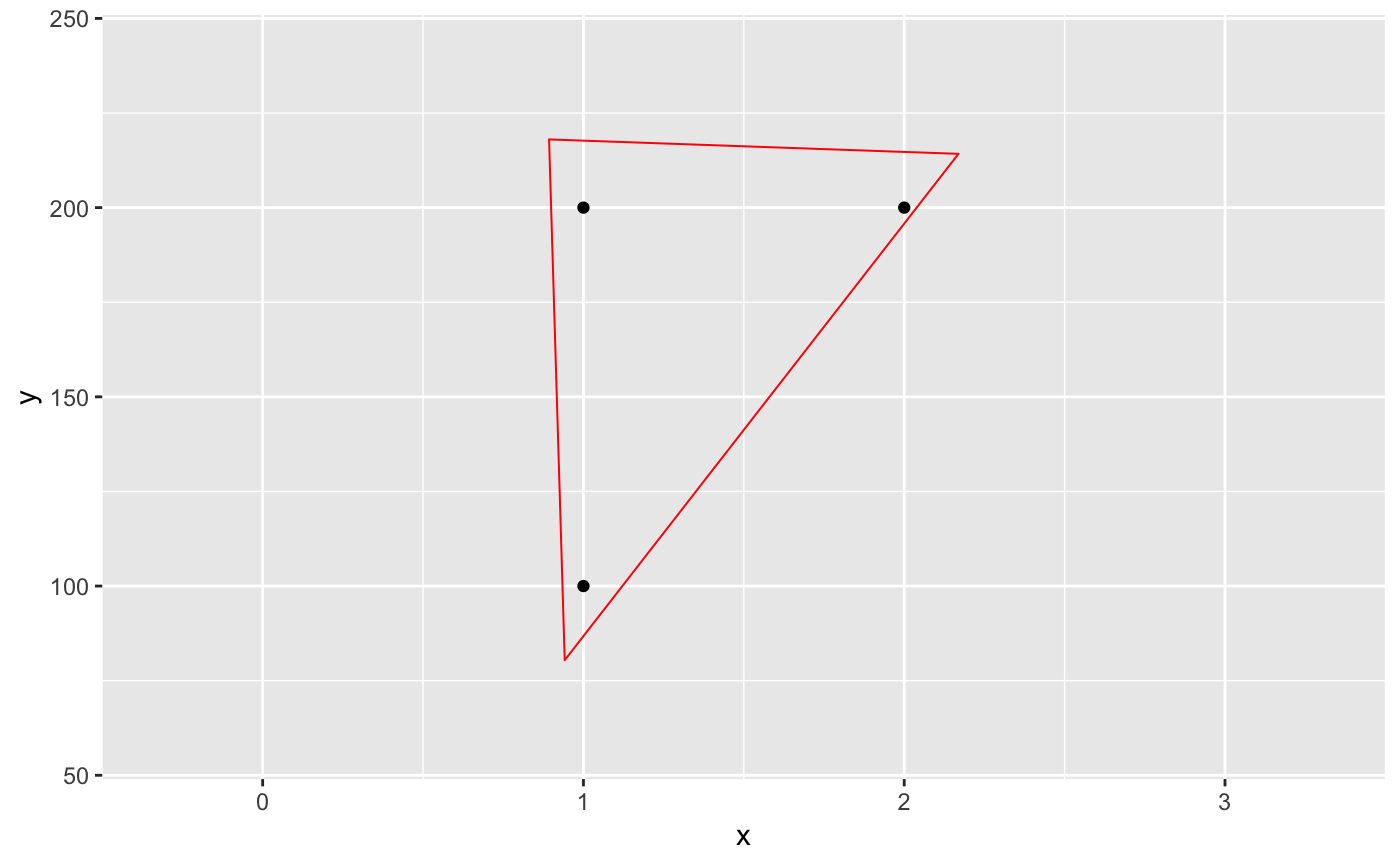
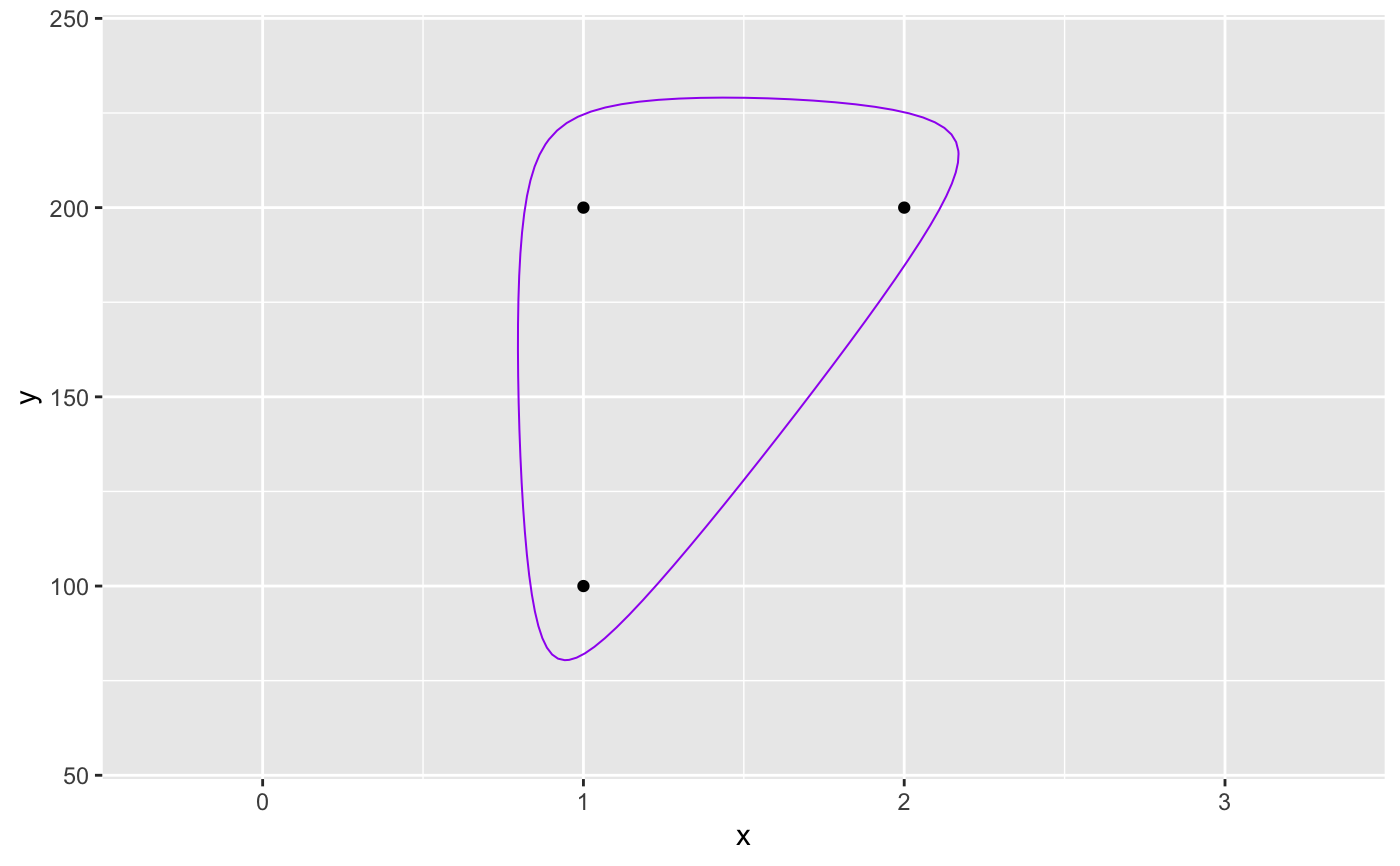
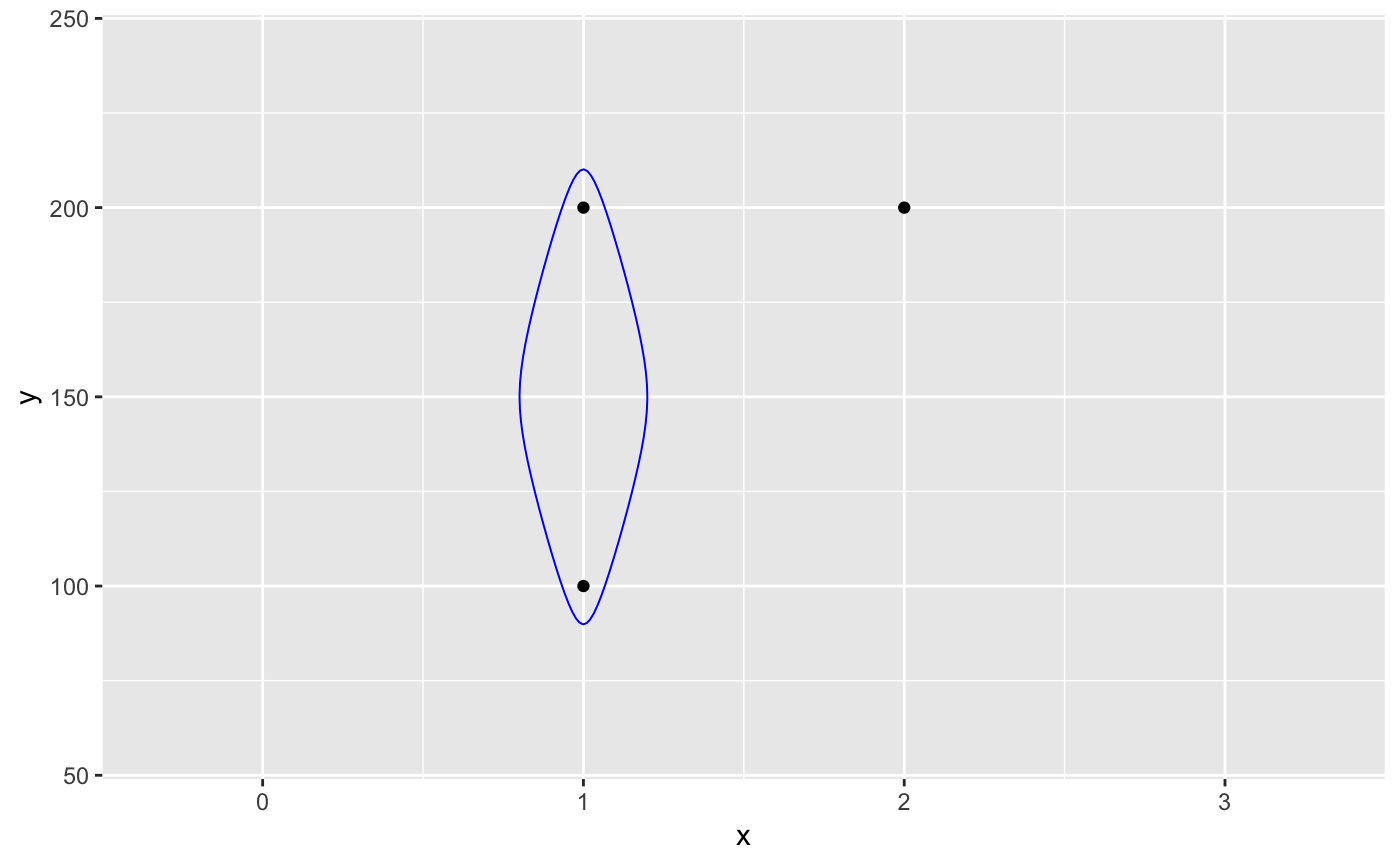
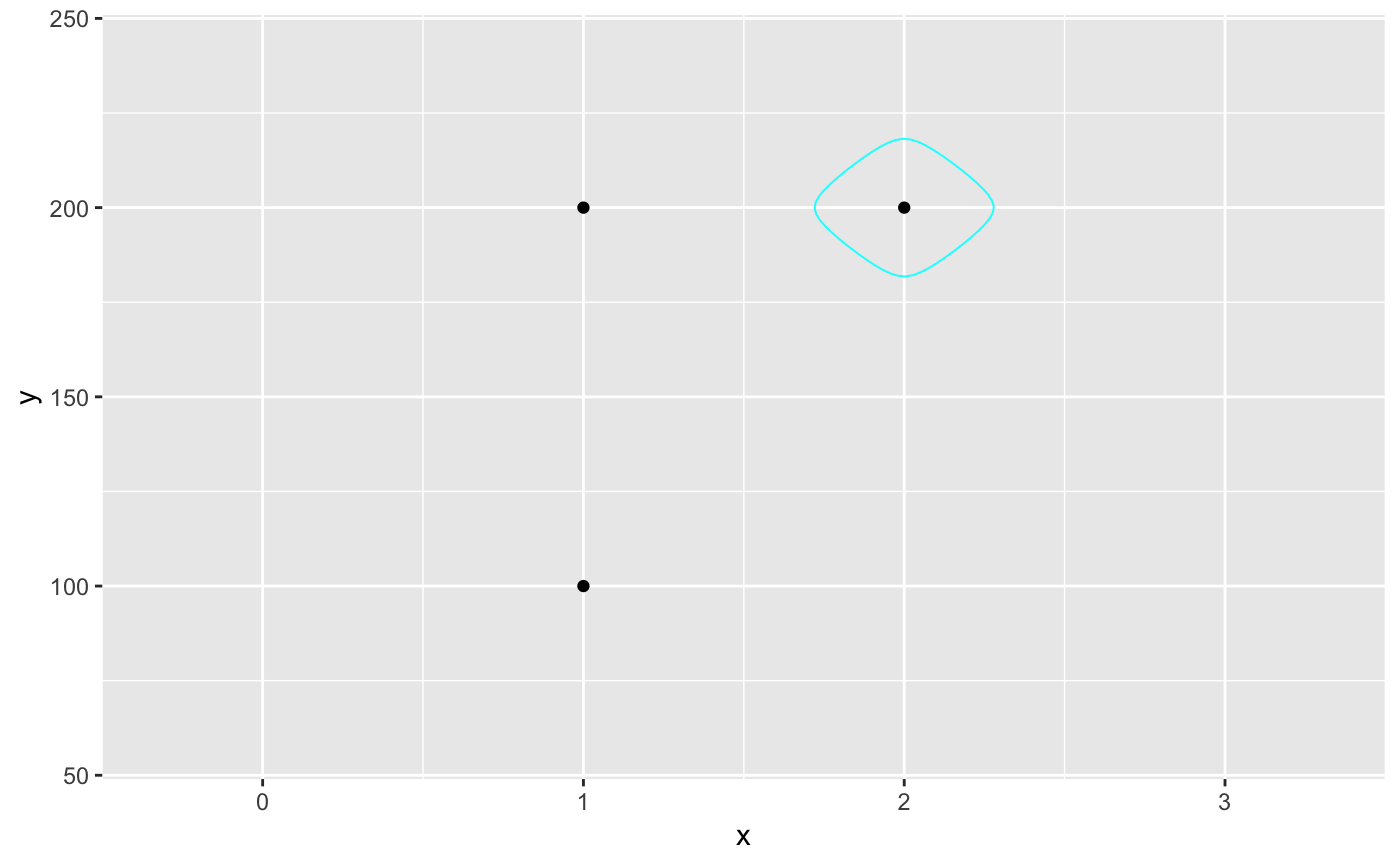
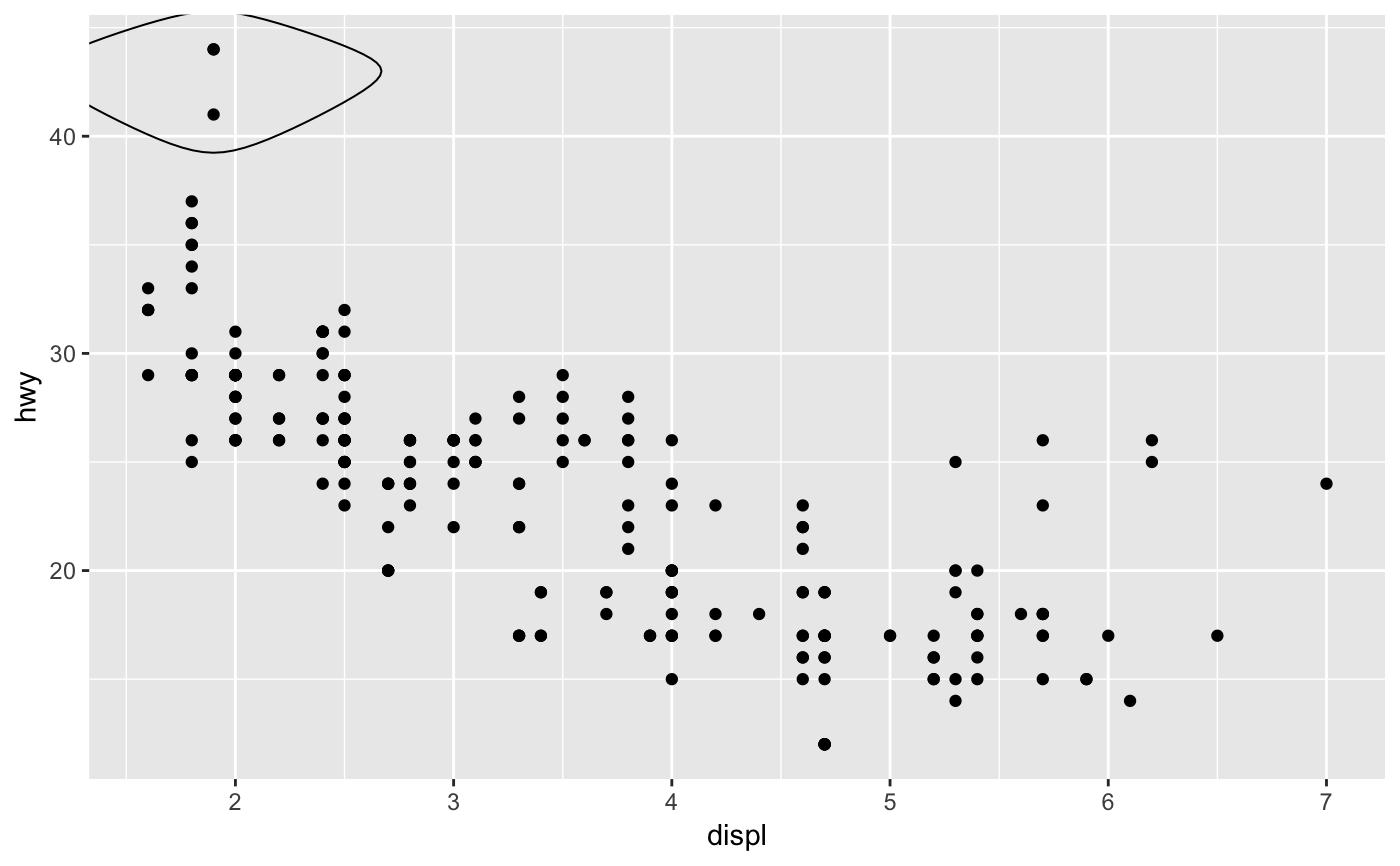
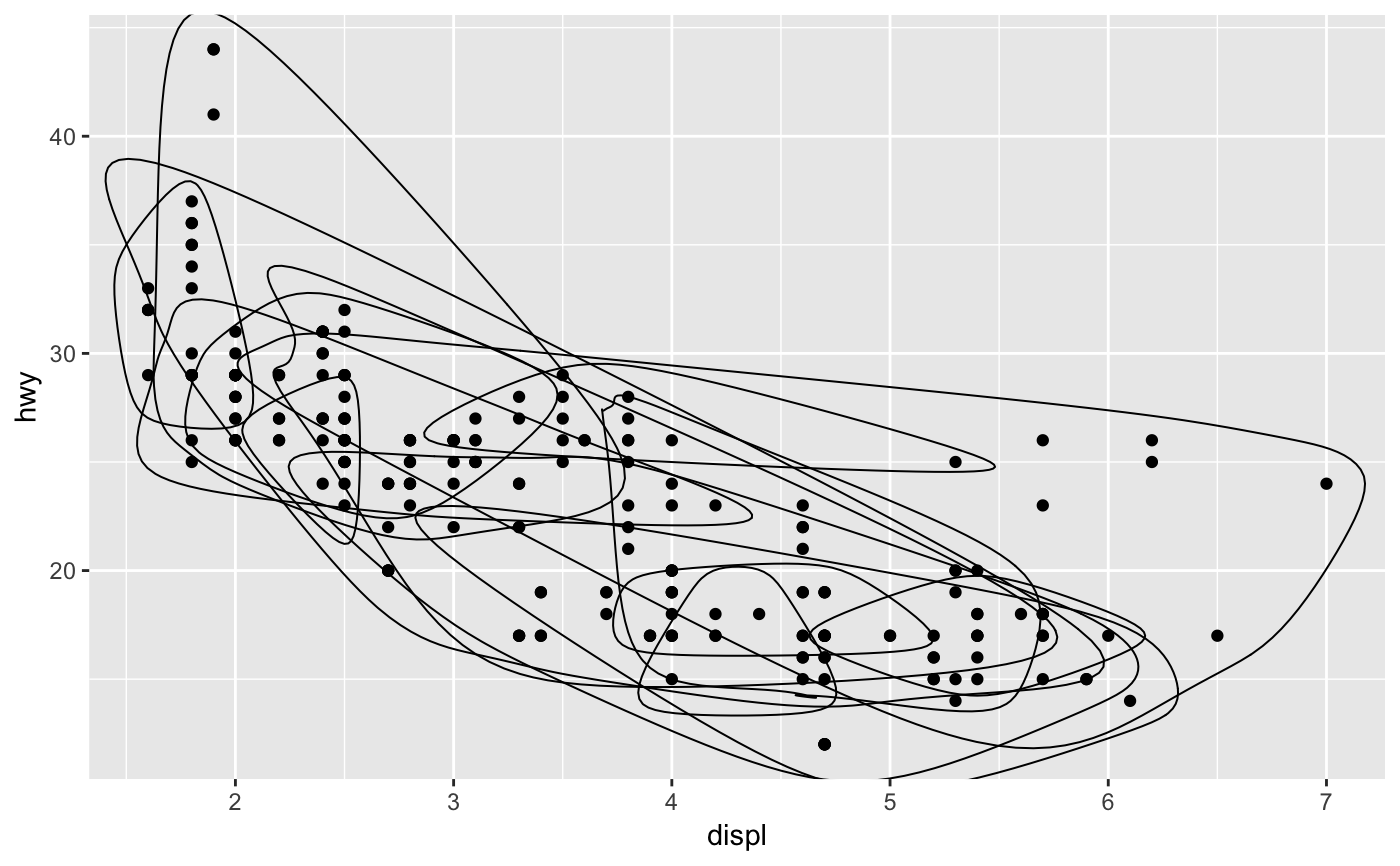
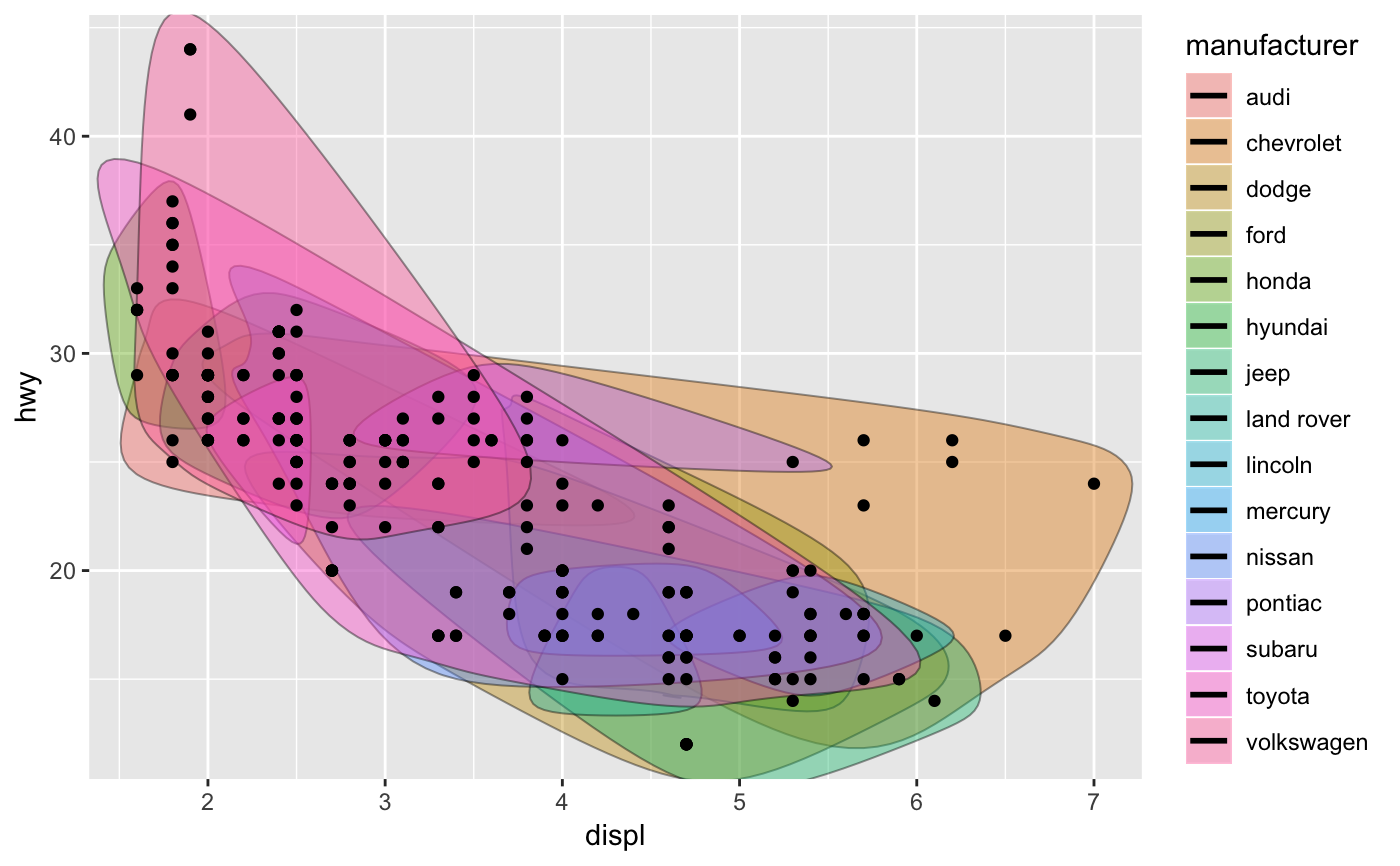
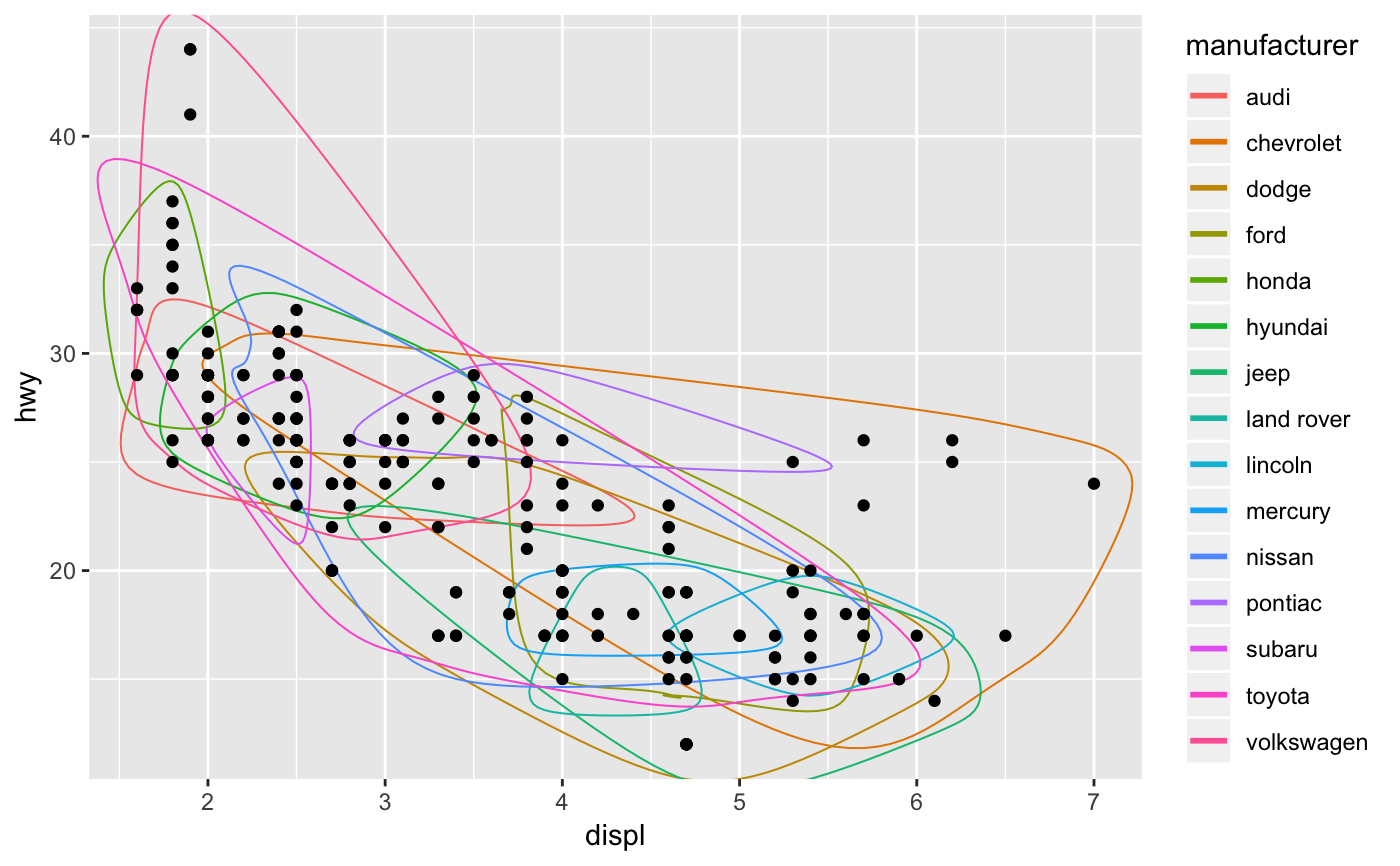
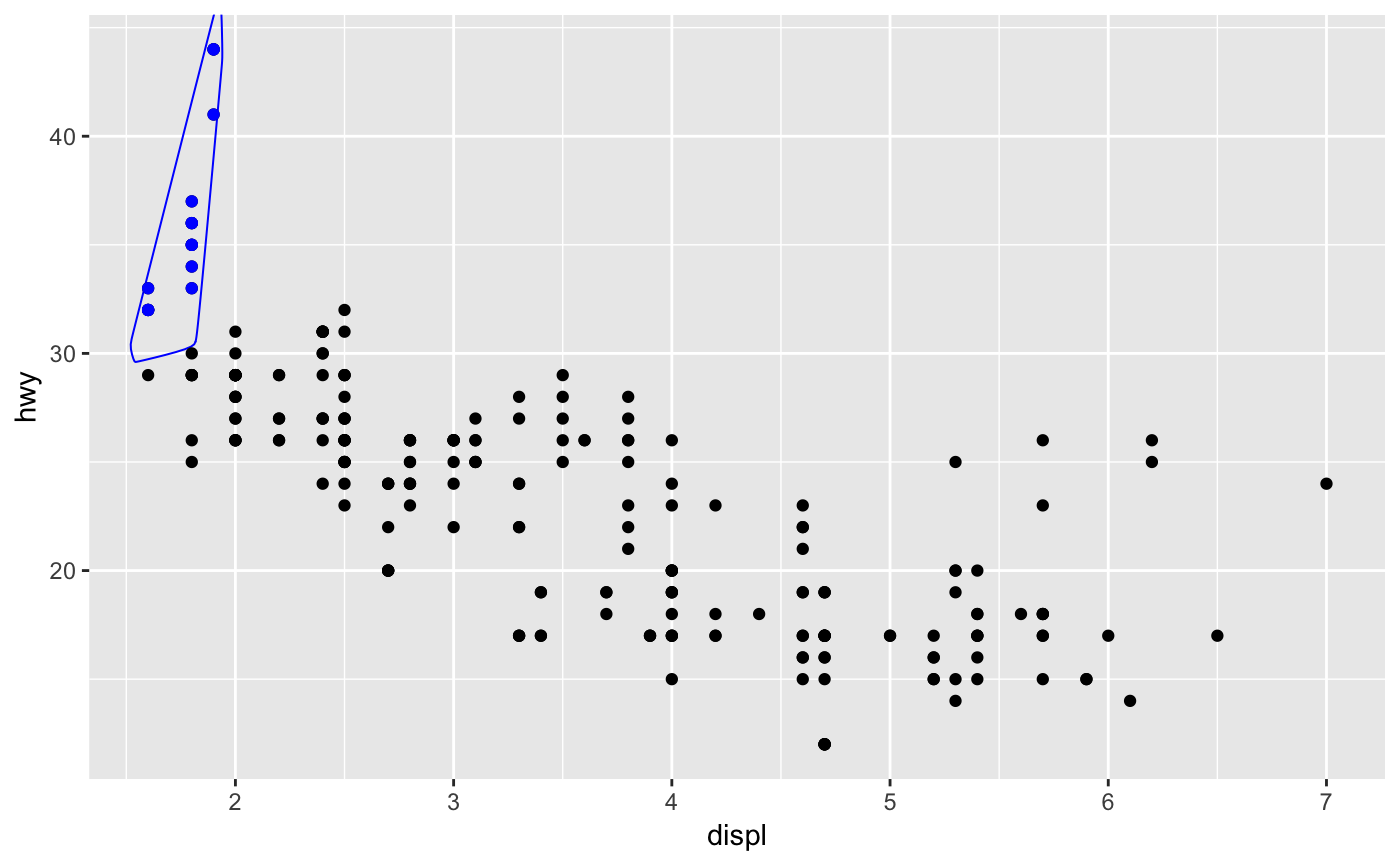
A sample of the output from geom_encircle():
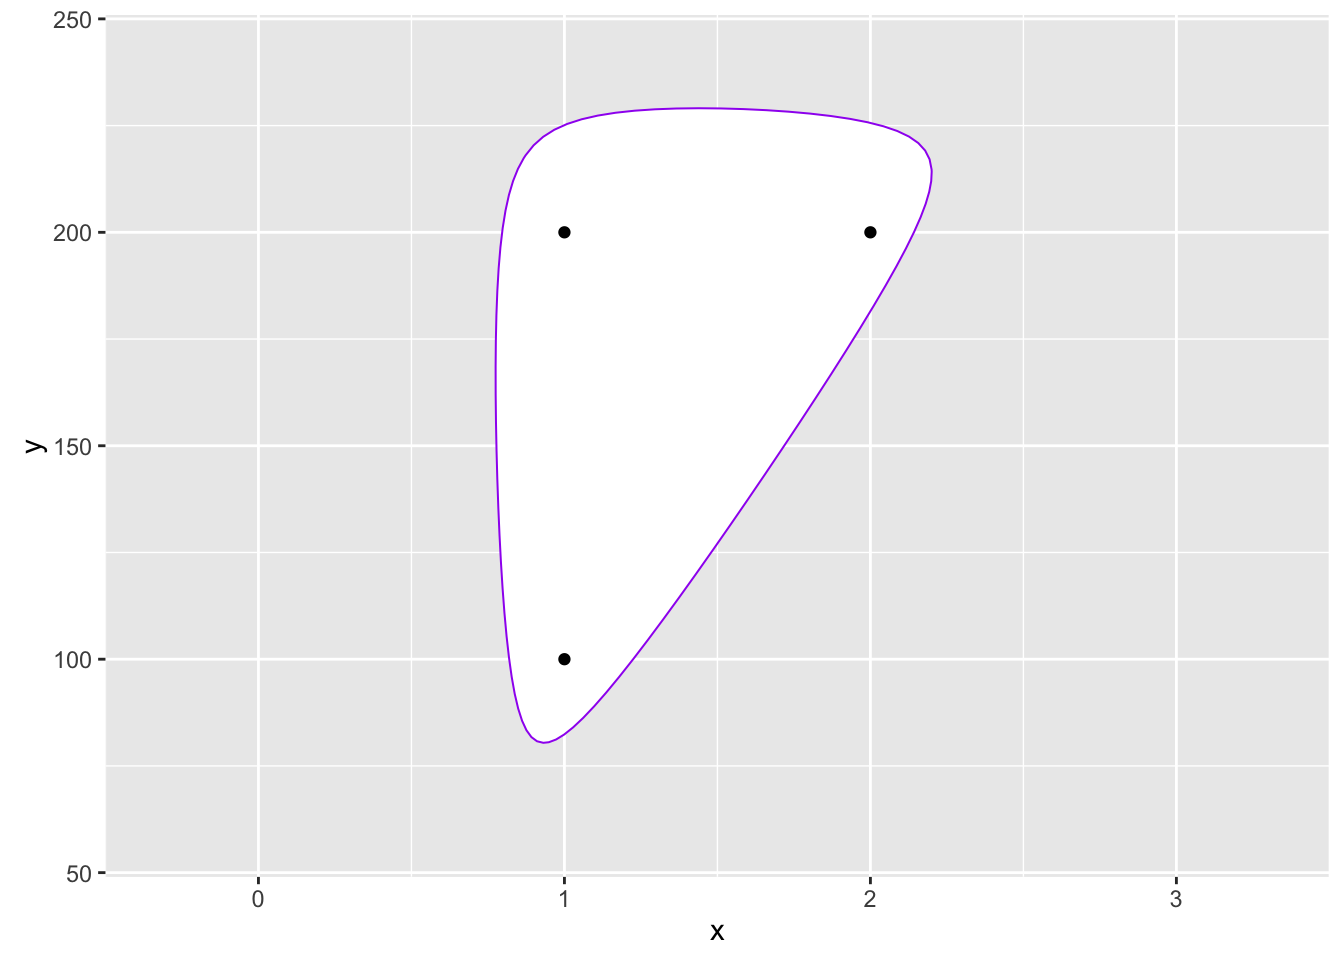
Examples
d <- data.frame(x=c(1,1,2),y=c(1,2,2)*100) gg <- ggplot(d,aes(x,y)) gg <- gg + scale_x_continuous(expand=c(0.5,1)) gg <- gg + scale_y_continuous(expand=c(0.5,1)) gg + geom_encircle(s_shape=1, expand=0) + geom_point()gg + geom_encircle(s_shape=1, expand=0.1, colour="red") + geom_point()gg + geom_encircle(s_shape=0.5, expand=0.1, colour="purple") + geom_point()gg + geom_encircle(data=subset(d, x==1), colour="blue", spread=0.02) + geom_point()gg +geom_encircle(data=subset(d, x==2), colour="cyan", spread=0.04) + geom_point()gg <- ggplot(mpg, aes(displ, hwy)) gg + geom_encircle(data=subset(mpg, hwy>40)) + geom_point()gg + geom_encircle(aes(group=manufacturer)) + geom_point()gg + geom_encircle(aes(group=manufacturer,fill=manufacturer),alpha=0.4)+ geom_point()gg + geom_encircle(aes(group=manufacturer,colour=manufacturer))+ geom_point()ss <- subset(mpg,hwy>31 & displ<2) gg + geom_encircle(data=ss, colour="blue", s_shape=0.9, expand=0.07) + geom_point() + geom_point(data=ss, colour="blue")