ggalt 0.6.2
  • Reference
  • Articles
    • Annotation Ticks
    • Density Plots
    • Dumbbell Charts
    • Encircling Points
    • Horizon Plots
    • Lollipop charts
    • Coord Projection
    • Spikelines
    • Spline Plots
    • ProPublica StateFace
    • Step Ribbons
    • Uniform Bars
    • Vertical Dodging
  • Changelog

Coord Projection

Bob Rudis

2019-02-22

Source: vignettes/proj.Rmd
proj.Rmd
library(ggalt)
#> Loading required package: ggplot2
library(proj4)

world <- ggplot2::map_data("world")

world <- world[world$region != "Antarctica",]
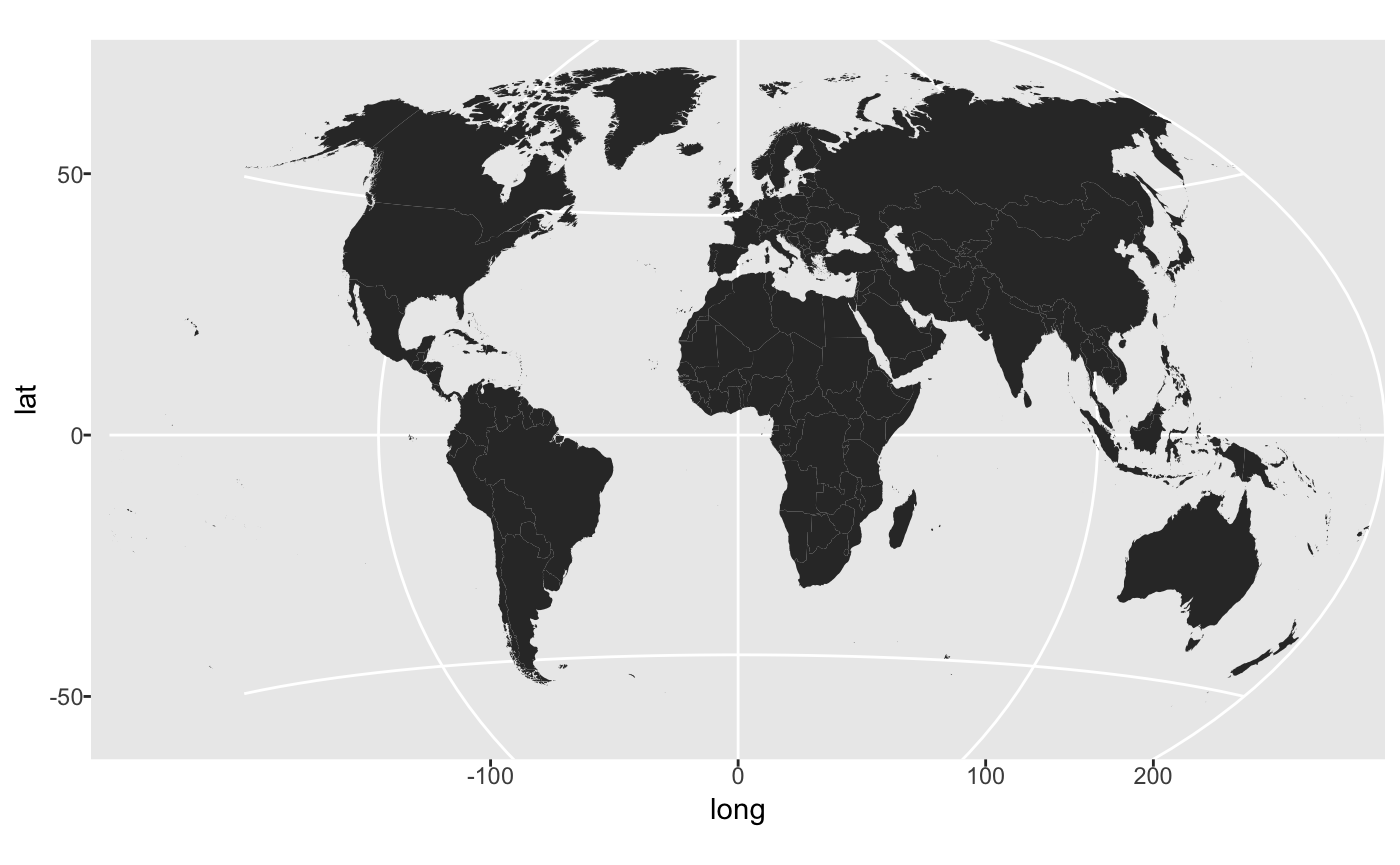
gg <- ggplot()

gg <- gg + geom_cartogram(data=world, map=world,
                    aes(x=long, y=lat, map_id=region))

gg <- gg + coord_proj("+proj=wintri")

gg
#> Warning: range backtransformation not implemented in this coord; results
#> may be wrong.
#> Warning: range calculation not implemented in this coord; results may be
#> wrong.

Developed by Bob Rudis, Ben Bolker, Jan Schulz, Aditya Kothari, Jonathan Sidi.

Site built with pkgdown.