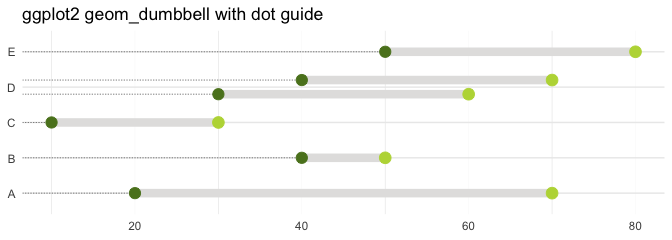
Vertical Dodging
df2 <- data.frame(trt = c(LETTERS[1:5], "D"),
                  l = c(20, 40, 10, 30, 50, 40),
                  r = c(70, 50, 30, 60, 80, 70))

ggplot(df2, aes(y=trt, x=l, xend=r)) +
  geom_dumbbell(size=3, color="#e3e2e1",
                colour_x = "#5b8124", colour_xend = "#bad744",
                dot_guide=TRUE, dot_guide_size=0.25,
                position=position_dodgev(height=0.8)) +
  labs(x=NULL, y=NULL, title="ggplot2 geom_dumbbell with dot guide") +
  theme_minimal() +
  theme(panel.grid.major.x=element_line(size=0.05))