Alternate (better) density plots
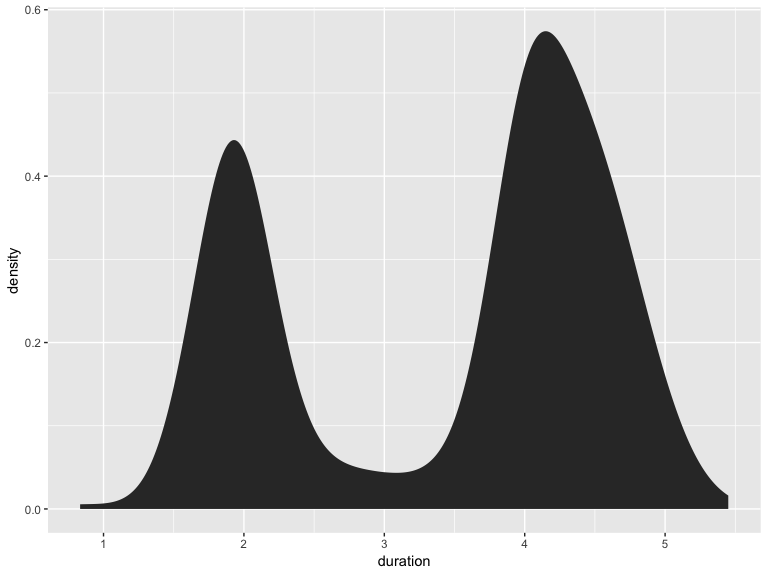
bkde


set.seed(1492)
dat <- data.frame(cond = factor(rep(c("A","B"), each=200)),
rating = c(rnorm(200),rnorm(200, mean=.8)))
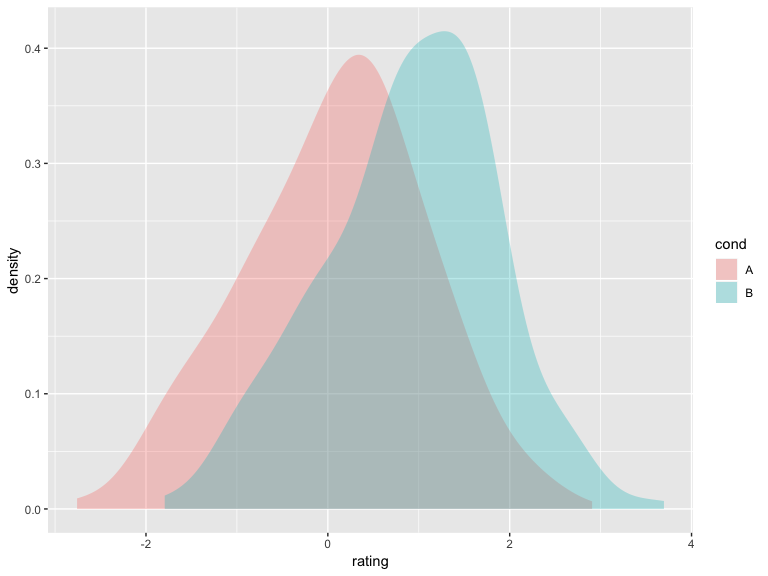
ggplot(dat, aes(x=rating, color=cond)) + geom_bkde(fill="#00000000")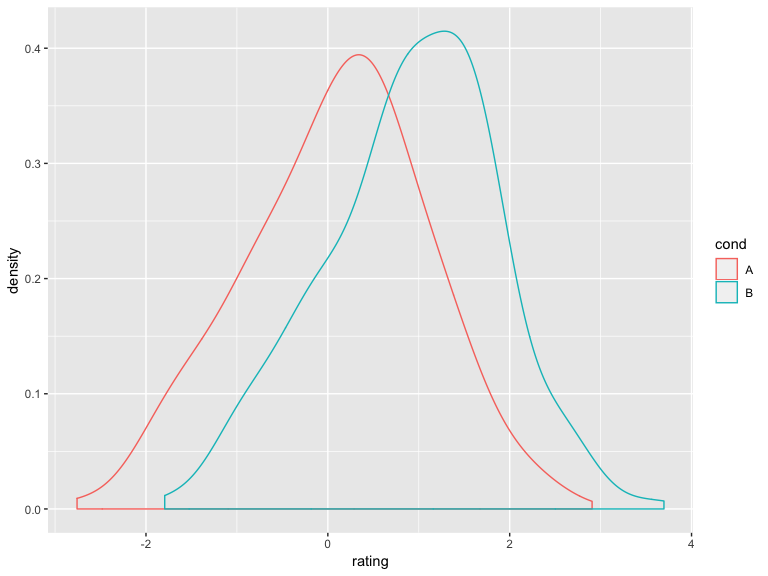
ash
set.seed(1492)

dat <- data.frame(x=rnorm(100))
grid.arrange(ggplot(dat, aes(x)) + stat_ash(),
             ggplot(dat, aes(x)) + stat_bkde(),
             ggplot(dat, aes(x)) + stat_density(),
             nrow=3)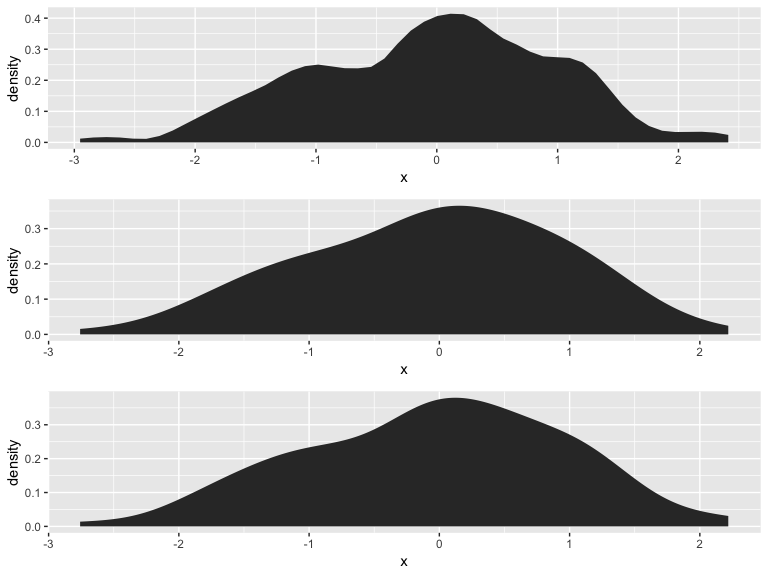
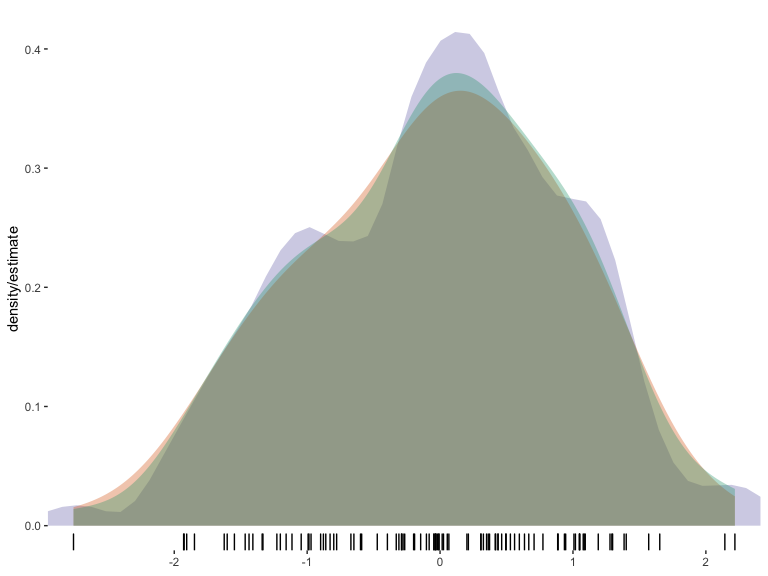
cols <- RColorBrewer::brewer.pal(3, "Dark2")
ggplot(dat, aes(x)) +
  stat_ash(alpha=1/3, fill=cols[3]) +
  stat_bkde(alpha=1/3, fill=cols[2]) +
  stat_density(alpha=1/3, fill=cols[1]) +
  geom_rug() +
  labs(x=NULL, y="density/estimate") +
  scale_x_continuous(expand=c(0,0)) +
  theme_bw() +
  theme(panel.grid=element_blank()) +
  theme(panel.border=element_blank())