The label parameter can be either a 2-letter state abbreviation
or a full state name. geom_stateface() will take care of the
translation to StateFace font glyph characters.
geom_stateface(mapping = NULL, data = NULL, stat = "identity",
  position = "identity", ..., parse = FALSE, nudge_x = 0,
  nudge_y = 0, check_overlap = FALSE, na.rm = FALSE,
  show.legend = NA, inherit.aes = TRUE)
Arguments
| mapping | Set of aesthetic mappings created by |
|---|---|
| data | The data to be displayed in this layer. There are three options: If A A |
| stat | The statistical transformation to use on the data for this layer, as a string. |
| position | Position adjustment, either as a string, or the result of a call to a position adjustment function. |
| ... | Other arguments passed on to |
| parse | If |
| nudge_x, nudge_y | Horizontal and vertical adjustment to nudge l abels by. Useful for offsetting text from points, particularly on discrete scales. |
| check_overlap | If |
| na.rm | If |
| show.legend | logical. Should this layer be included in the legends?
|
| inherit.aes | If |
Details
The package will also take care of loading the StateFace font for PDF and other devices, but to use it with the on-screen ggplot2 device, you'll need to install the font on your system.
ggalt ships with a copy of the StateFace TTF font. You can
run show_stateface() to get the filesystem location and then
load the font manually from there.
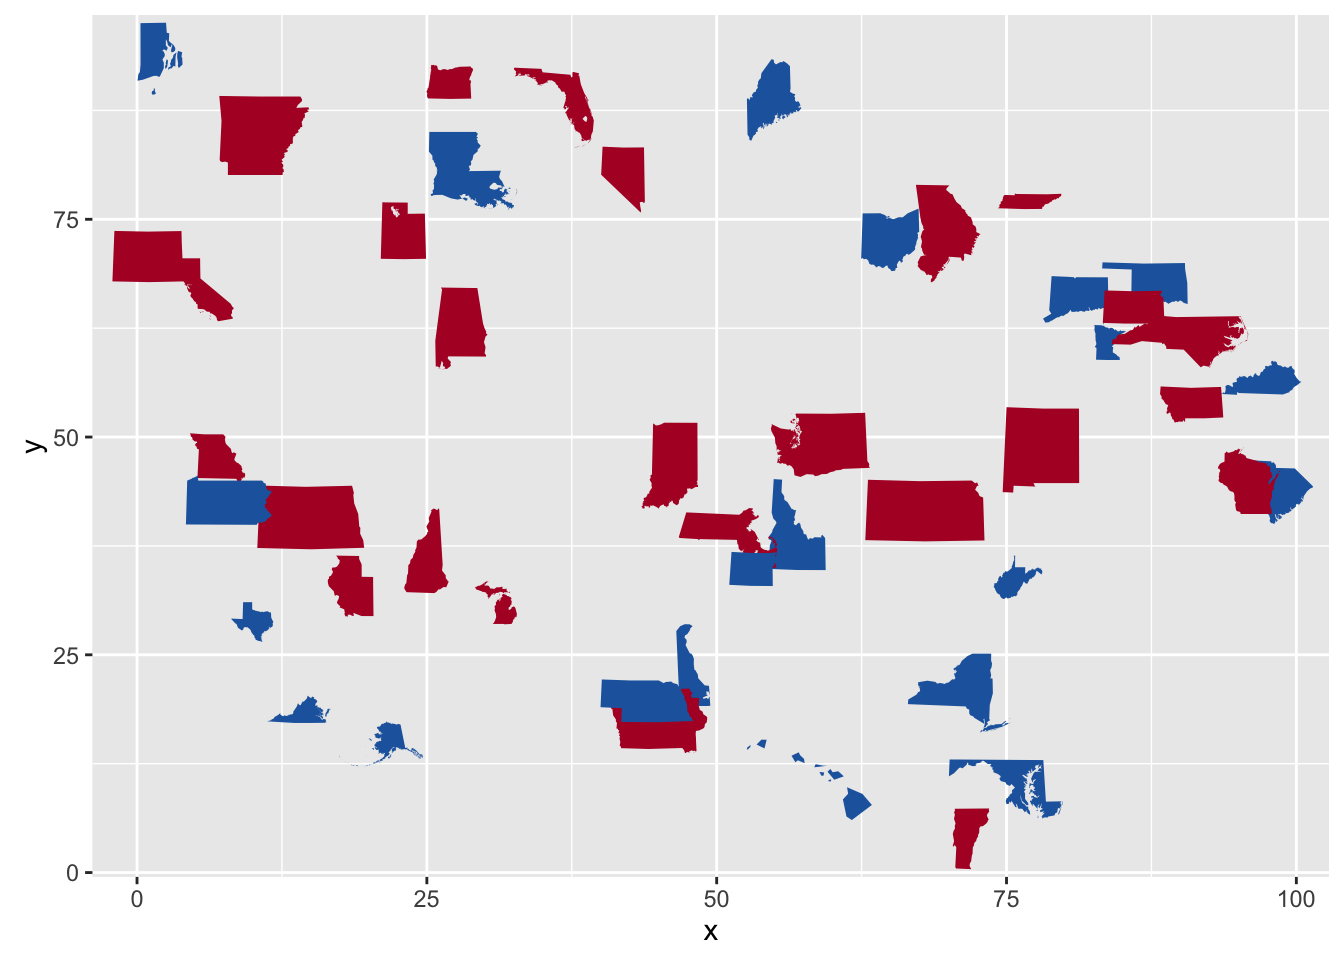
A sample of the output from geom_stateface():
See also
Other StateFace operations: load_stateface,
show_stateface
Examples
# NOT RUN {
library(ggplot2)
library(ggalt)

# Run show_stateface() to see the location of the TTF StateFace font
# You need to install it for it to work

set.seed(1492)
dat <- data.frame(state=state.abb,
                  x=sample(100, 50),
                  y=sample(100, 50),
                  col=sample(c("#b2182b", "#2166ac"), 50, replace=TRUE),
                  sz=sample(6:15, 50, replace=TRUE),
                  stringsAsFactors=FALSE)
gg <- ggplot(dat, aes(x=x, y=y))
gg <- gg + geom_stateface(aes(label=state, color=col, size=sz))
gg <- gg + scale_color_identity()
gg <- gg + scale_size_identity()
gg
# }