Draw an X-spline, a curve drawn relative to control points/observations.
Patterned after geom_line in that it orders the points by x
first before computing the splines.
geom_xspline(mapping = NULL, data = NULL, stat = "xspline",
  position = "identity", na.rm = TRUE, show.legend = NA,
  inherit.aes = TRUE, spline_shape = -0.25, open = TRUE,
  rep_ends = TRUE, ...)

stat_xspline(mapping = NULL, data = NULL, geom = "line",
  position = "identity", na.rm = TRUE, show.legend = NA,
  inherit.aes = TRUE, spline_shape = -0.25, open = TRUE,
  rep_ends = TRUE, ...)
Arguments
| mapping | Set of aesthetic mappings created by |
|---|---|
| data | The data to be displayed in this layer. There are three options: If A A |
| position | Position adjustment, either as a string, or the result of a call to a position adjustment function. |
| na.rm | If |
| show.legend | logical. Should this layer be included in the legends?
|
| inherit.aes | If |
| spline_shape | A numeric vector of values between -1 and 1, which control the shape of the spline relative to the control points. |
| open | A logical value indicating whether the spline is an open or a closed shape. |
| rep_ends | For open X-splines, a logical value indicating whether the first and last control points should be replicated for drawing the curve. Ignored for closed X-splines. |
| ... | Other arguments passed on to |
| geom, stat | Use to override the default connection between
|
Details
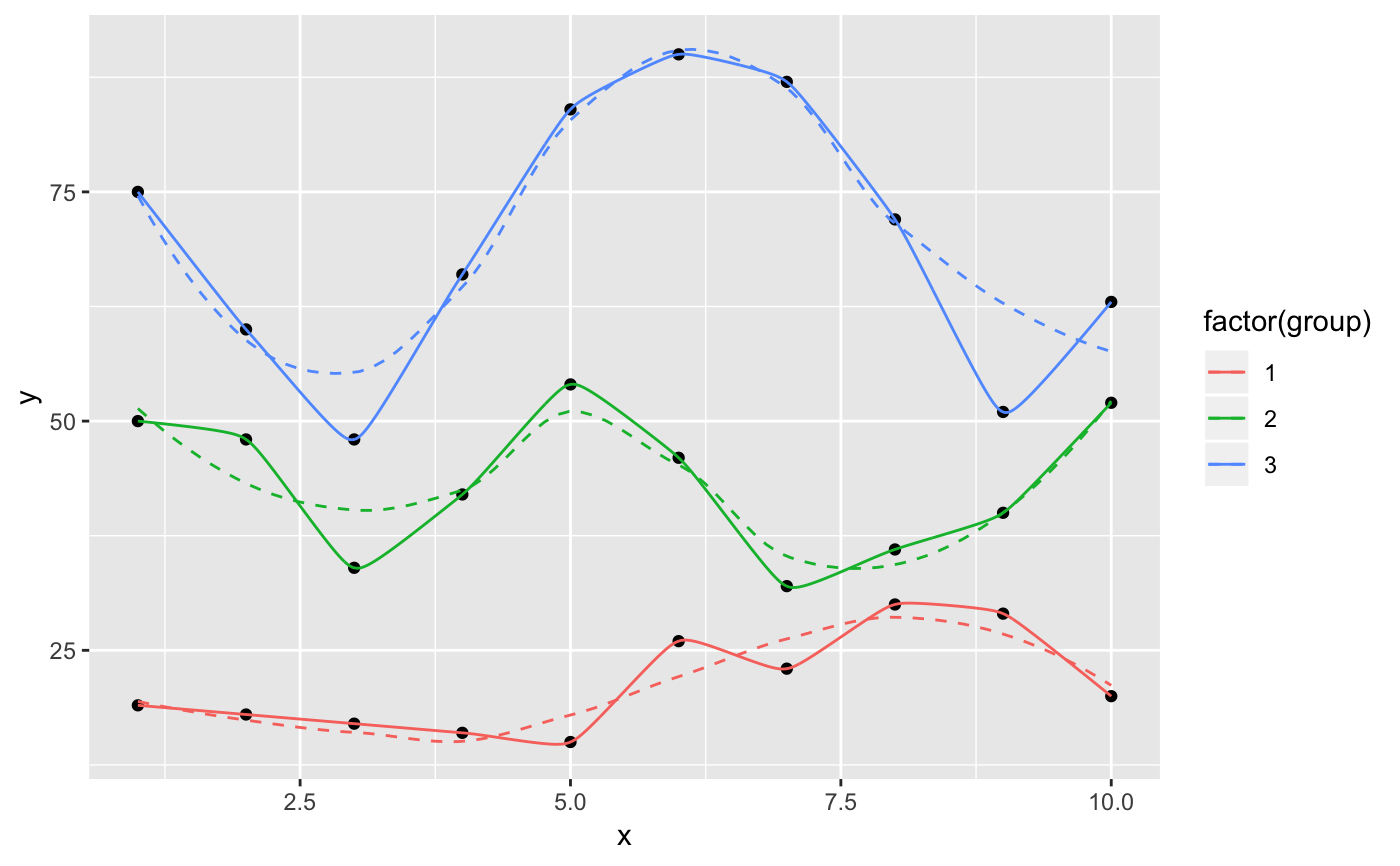
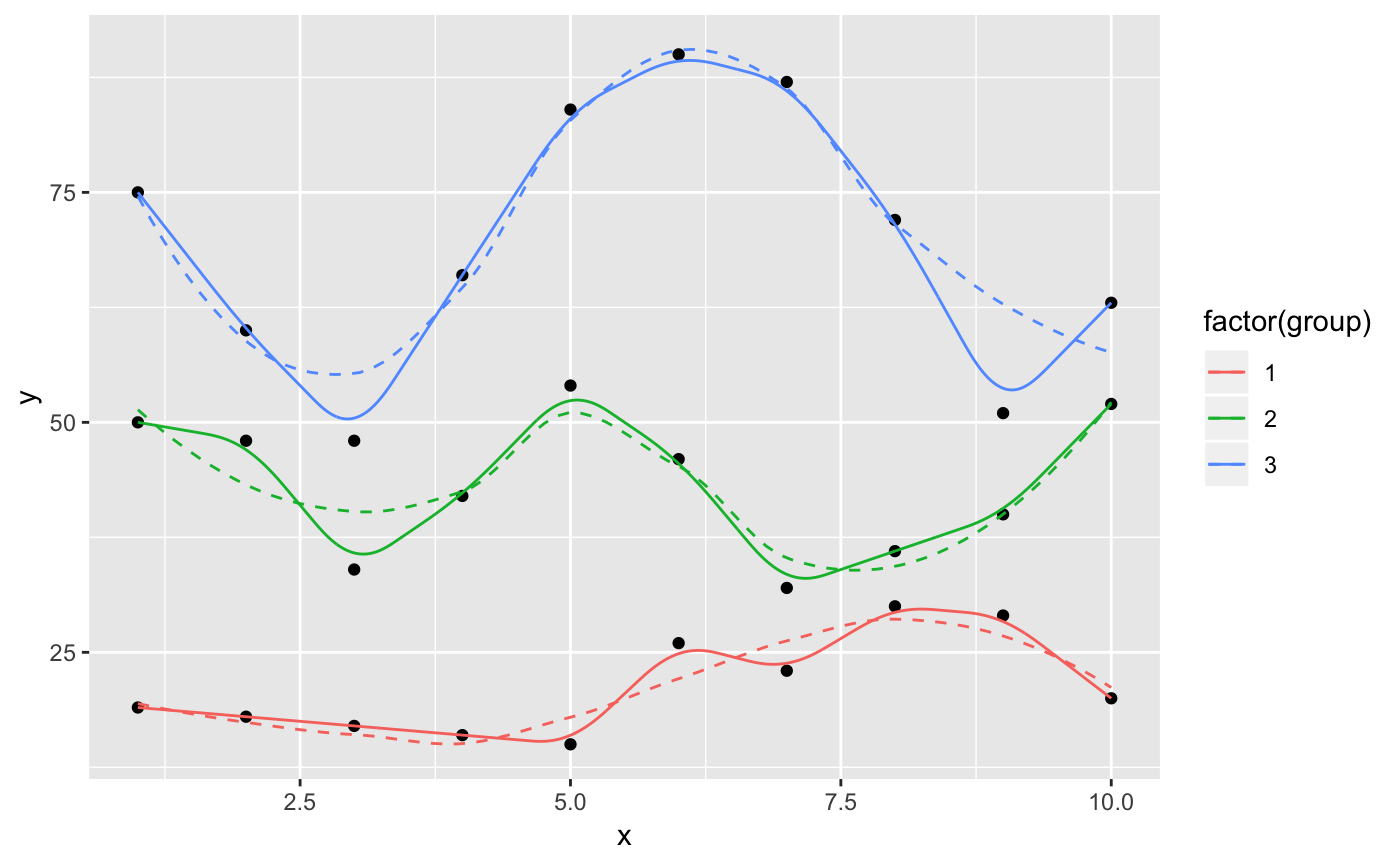
A sample of the output from geom_xspline():
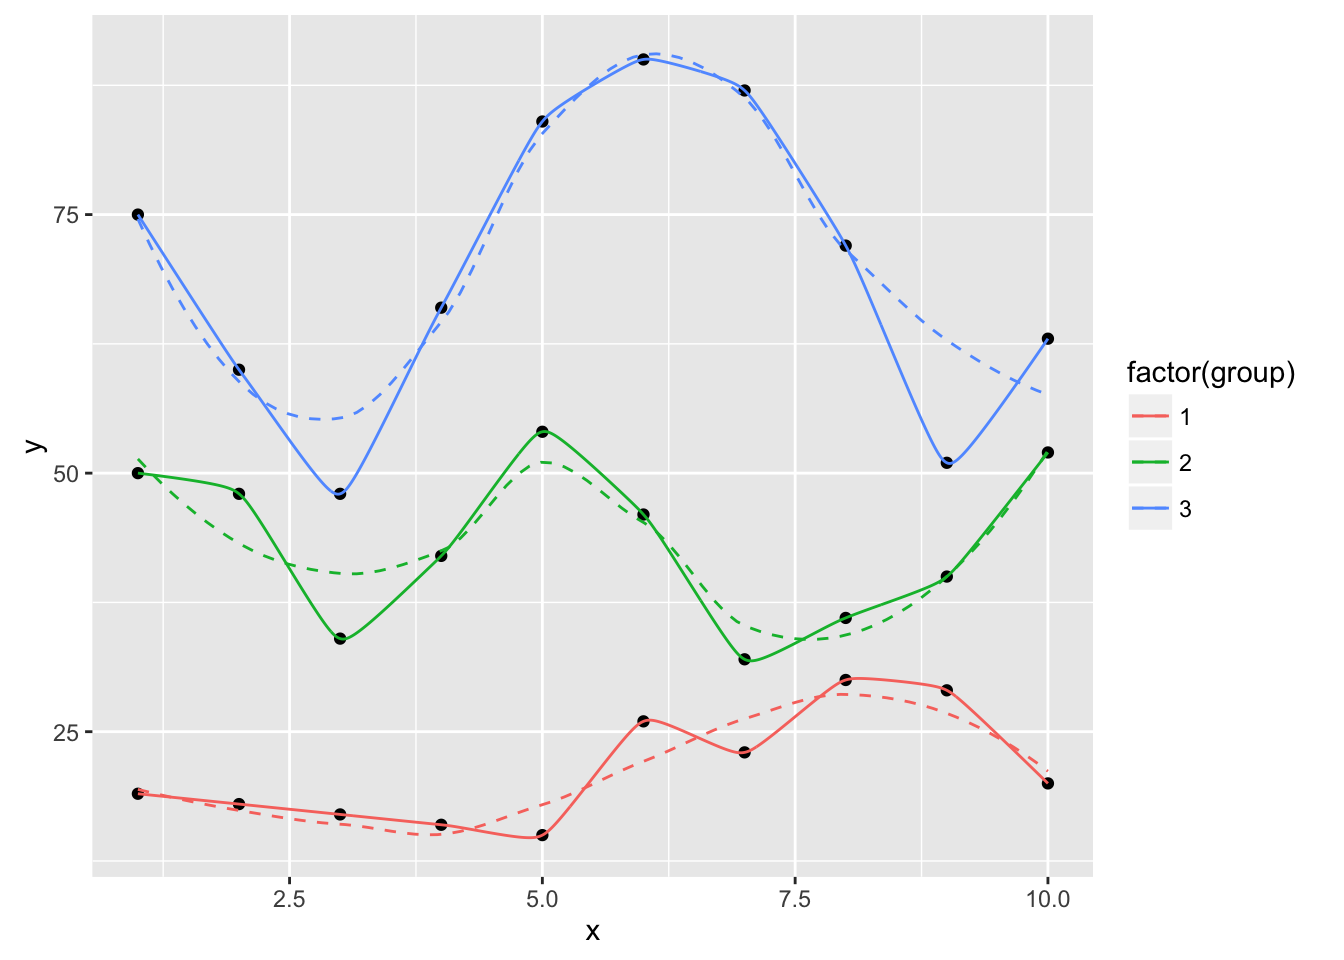
An X-spline is a line drawn relative to control points. For each control point, the line may pass through (interpolate) the control point or it may only approach (approximate) the control point; the behaviour is determined by a shape parameter for each control point.
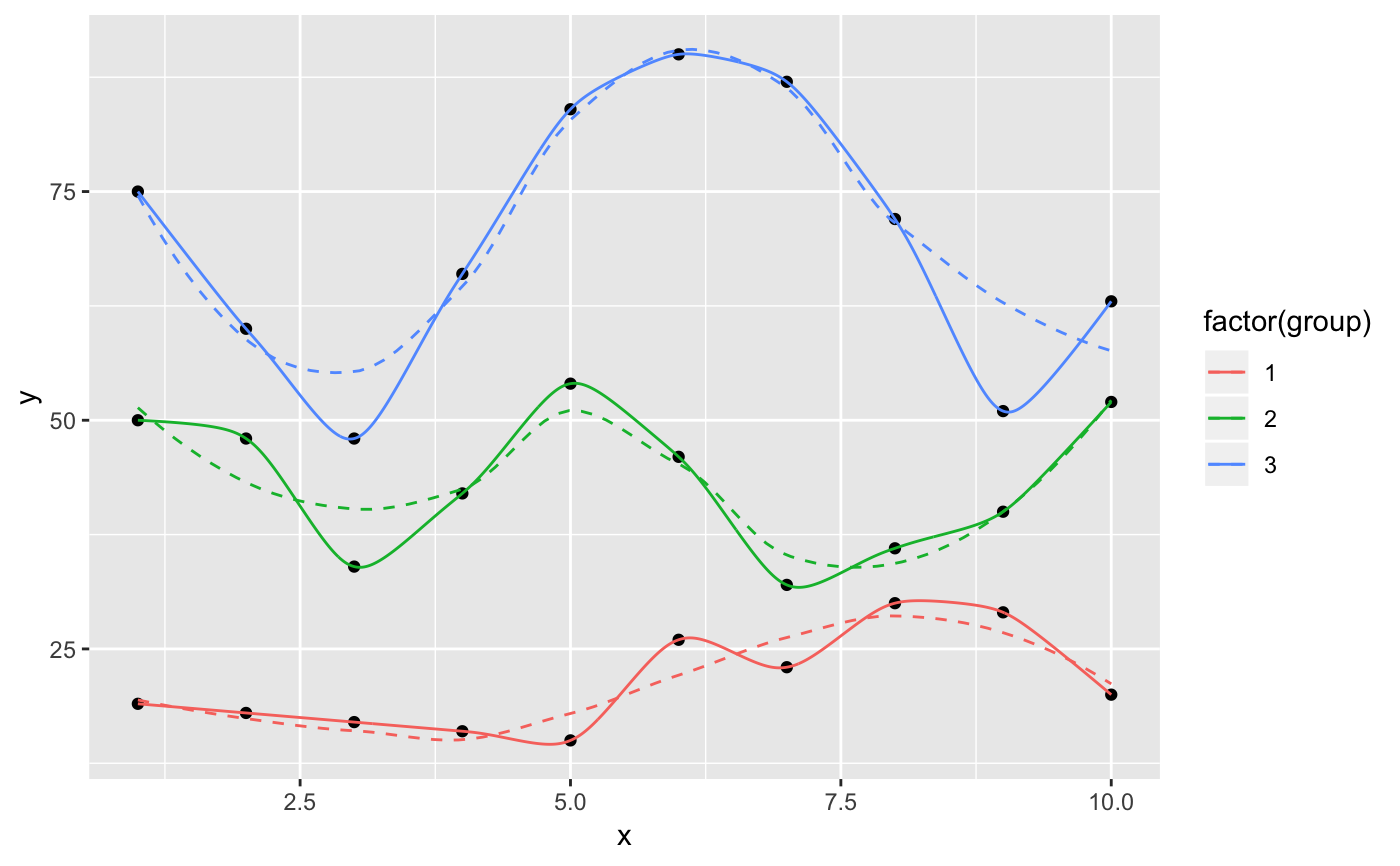
If the shape parameter is greater than zero, the spline approximates the control points (and is very similar to a cubic B-spline when the shape is 1). If the shape parameter is less than zero, the spline interpolates the control points (and is very similar to a Catmull-Rom spline when the shape is -1). If the shape parameter is 0, the spline forms a sharp corner at that control point.
For open X-splines, the start and end control points must have a shape of 0 (and non-zero values are silently converted to zero).
For open X-splines, by default the start and end control points are replicated before the curve is drawn. A curve is drawn between (interpolating or approximating) the second and third of each set of four control points, so this default behaviour ensures that the resulting curve starts at the first control point you have specified and ends at the last control point. The default behaviour can be turned off via the repEnds argument.
Aesthetics
geom_xspline understands the following aesthetics (required aesthetics
are in bold):
xyalphacolorlinetypesize
Computed variables
x
y
References
Blanc, C. and Schlick, C. (1995), "X-splines : A Spline Model Designed for the End User", in Proceedings of SIGGRAPH 95, pp. 377-386. http://dept-info.labri.fr/~schlick/DOC/sig1.html
See also
geom_line: Connect observations (x order);
geom_path: Connect observations;
geom_polygon: Filled paths (polygons);
geom_segment: Line segments;
xspline;
grid.xspline
Other xspline implementations: geom_xspline2
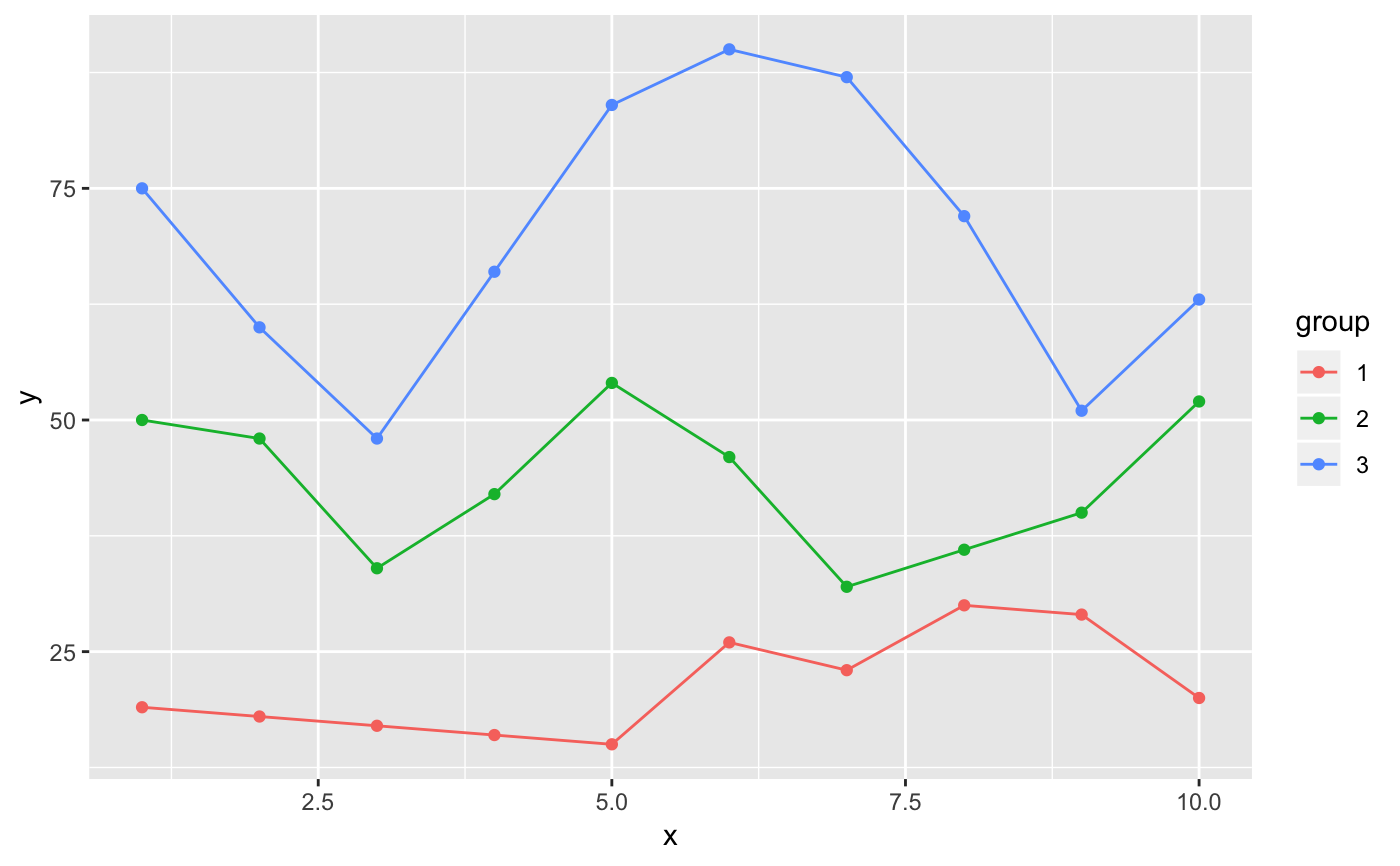
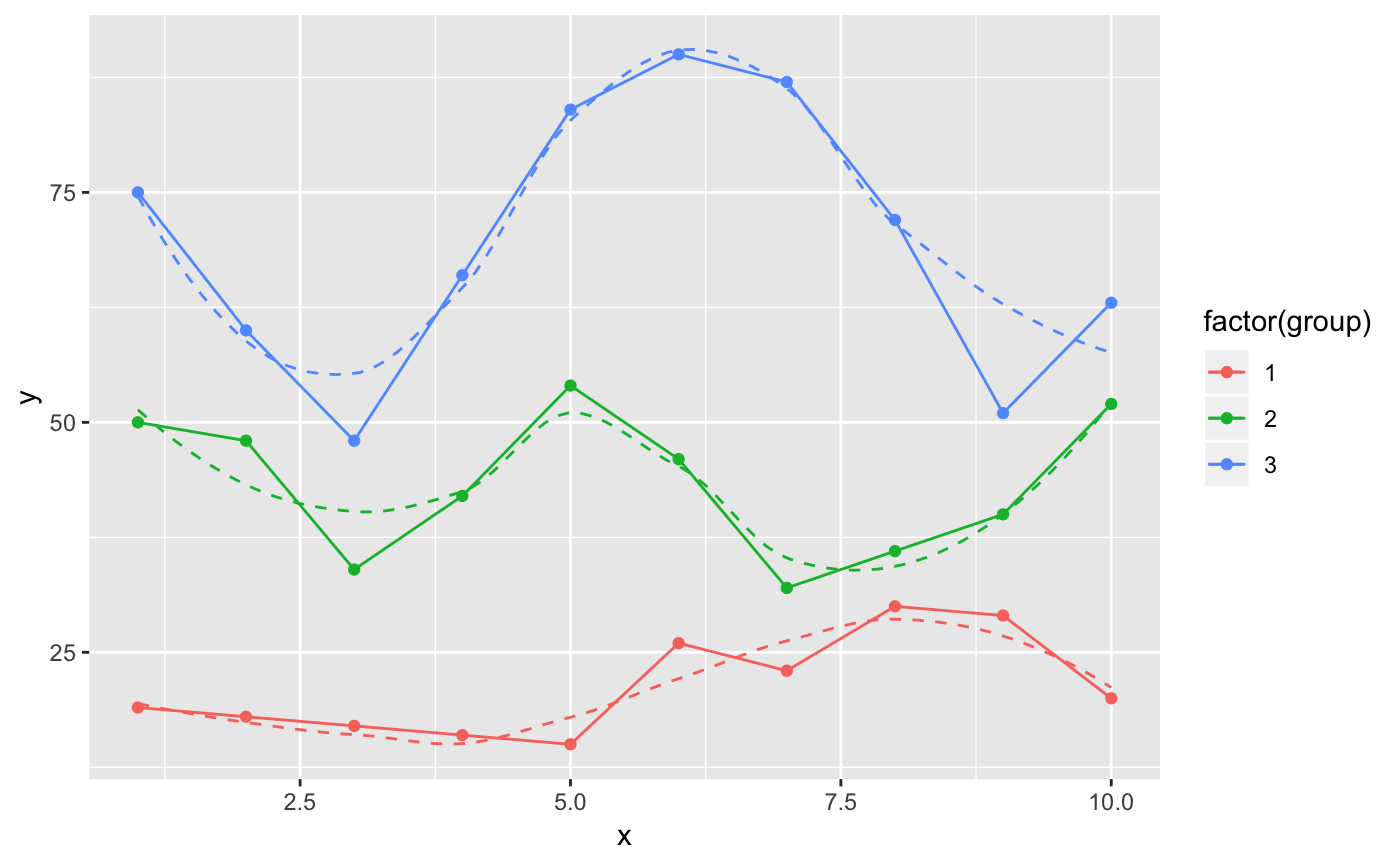
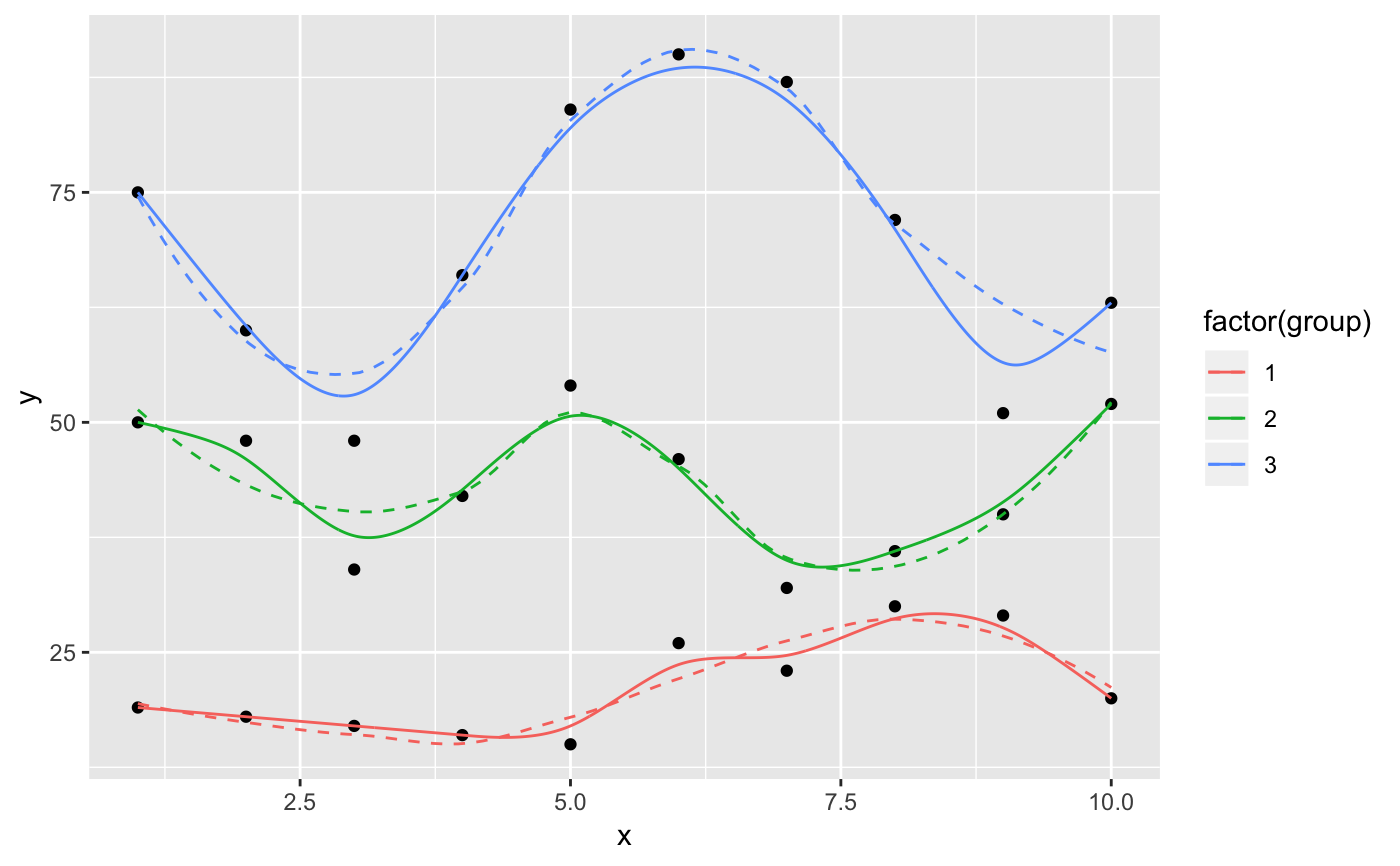
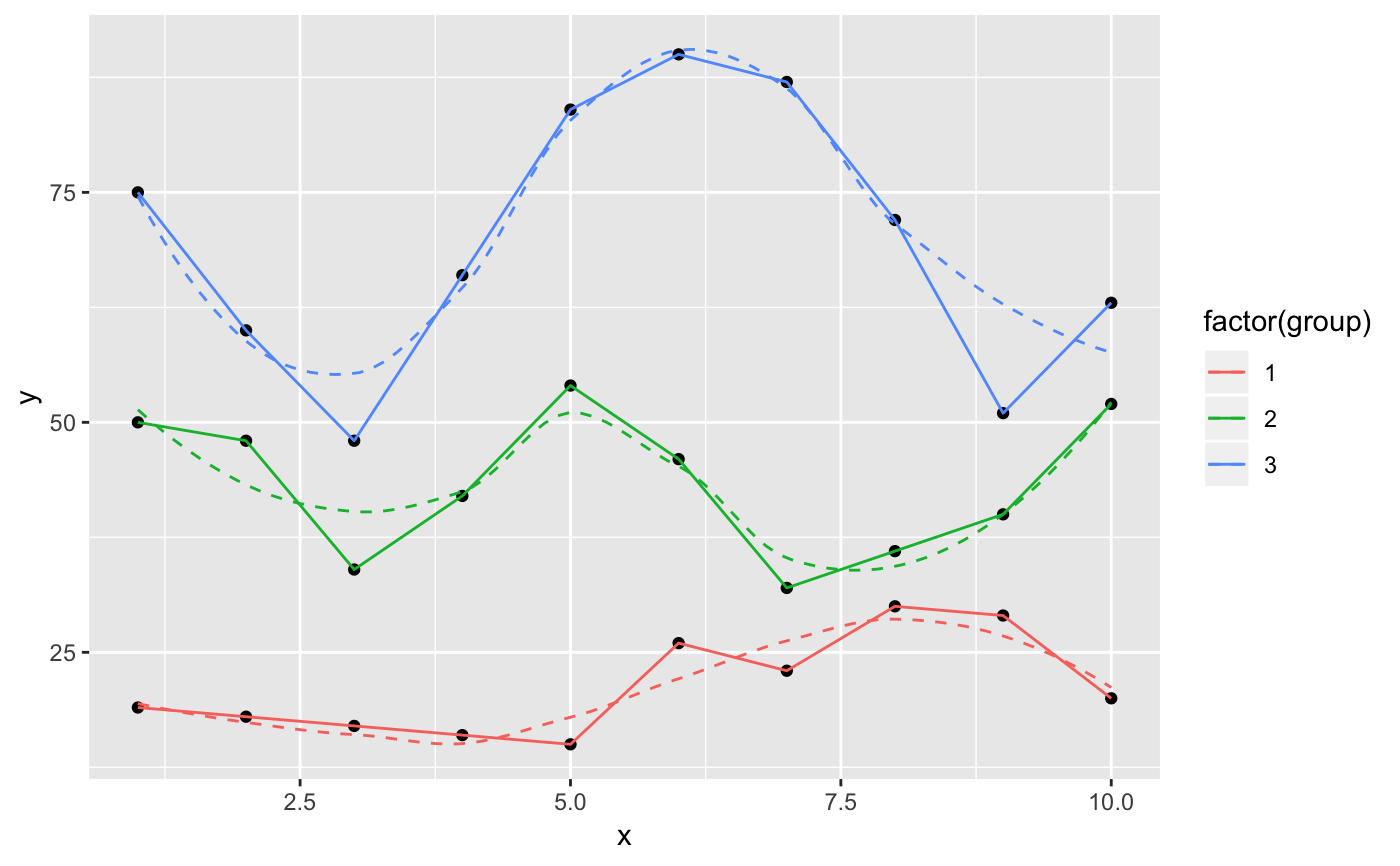
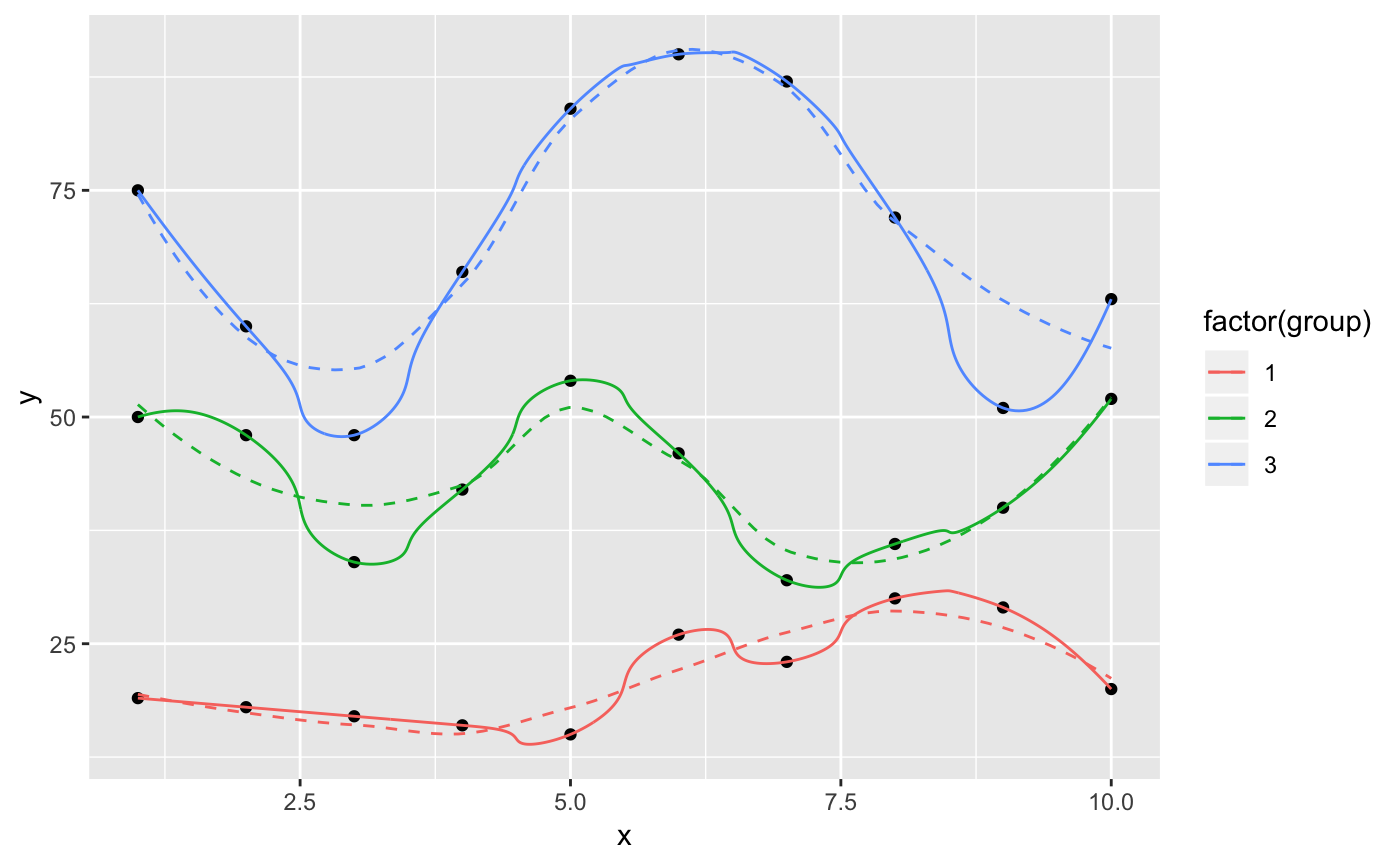
Examples
set.seed(1492) dat <- data.frame(x=c(1:10, 1:10, 1:10), y=c(sample(15:30, 10), 2*sample(15:30, 10), 3*sample(15:30, 10)), group=factor(c(rep(1, 10), rep(2, 10), rep(3, 10))) ) ggplot(dat, aes(x, y, group=group, color=group)) + geom_point() + geom_line()ggplot(dat, aes(x, y, group=group, color=factor(group))) + geom_point() + geom_line() + geom_smooth(se=FALSE, linetype="dashed", size=0.5)#>ggplot(dat, aes(x, y, group=group, color=factor(group))) + geom_point(color="black") + geom_smooth(se=FALSE, linetype="dashed", size=0.5) + geom_xspline(size=0.5)#>ggplot(dat, aes(x, y, group=group, color=factor(group))) + geom_point(color="black") + geom_smooth(se=FALSE, linetype="dashed", size=0.5) + geom_xspline(spline_shape=-0.4, size=0.5)#>ggplot(dat, aes(x, y, group=group, color=factor(group))) + geom_point(color="black") + geom_smooth(se=FALSE, linetype="dashed", size=0.5) + geom_xspline(spline_shape=0.4, size=0.5)#>ggplot(dat, aes(x, y, group=group, color=factor(group))) + geom_point(color="black") + geom_smooth(se=FALSE, linetype="dashed", size=0.5) + geom_xspline(spline_shape=1, size=0.5)#>ggplot(dat, aes(x, y, group=group, color=factor(group))) + geom_point(color="black") + geom_smooth(se=FALSE, linetype="dashed", size=0.5) + geom_xspline(spline_shape=0, size=0.5)#>ggplot(dat, aes(x, y, group=group, color=factor(group))) + geom_point(color="black") + geom_smooth(se=FALSE, linetype="dashed", size=0.5) + geom_xspline(spline_shape=-1, size=0.5)#>